In Adventures in Benchmarking, Part 1, David Golden ran a benchmark program to compare Path::Tiny‘s slurp against itself several times. He thought he had discovered a problem with the ordering of code in Benchmark, which runs the code in the lexigraphical order of their labels. He created several subroutines that did the same thing:
use v5.10;
use strict;
use warnings;
use Benchmark qw( cmpthese );
use Path::Tiny;

my $file = "ascii-large";

my $count = -1;
cmpthese(
    $count,
    {
        map { $_ => sub { path($file)->slurp } } ("a" .. "l")
    }
);
His results looked surprising, and I was a bit excited about this because I was working on the “Benchmarking” chapter of Mastering Perl the day that I read this. These numbers would make an excellent story:
l 1599/s   -- -14% -15% -19% -20% -20% -21% -21% -21% -23% -23% -23%
h 1866/s  17%   --  -1%  -6%  -6%  -7%  -8%  -8%  -8% -10% -10% -10%
i 1879/s  17%   1%   --  -5%  -6%  -6%  -8%  -8%  -8%  -9%  -9%  -9%
j 1981/s  24%   6%   5%   --  -1%  -1%  -3%  -3%  -3%  -4%  -4%  -4%
f 1995/s  25%   7%   6%   1%   --  -0%  -2%  -2%  -2%  -3%  -4%  -4%
b 1999/s  25%   7%   6%   1%   0%   --  -2%  -2%  -2%  -3%  -3%  -4%
g 2033/s  27%   9%   8%   3%   2%   2%   --  -0%  -0%  -2%  -2%  -2%
c 2035/s  27%   9%   8%   3%   2%   2%   0%   --  -0%  -2%  -2%  -2%
a 2036/s  27%   9%   8%   3%   2%   2%   0%   0%   --  -1%  -2%  -2%
e 2067/s  29%  11%  10%   4%   4%   3%   2%   2%   2%   --  -0%  -0%
k 2070/s  29%  11%  10%   4%   4%   4%   2%   2%   2%   0%   --  -0%
d 2074/s  30%  11%  10%   5%   4%   4%   2%   2%   2%   0%   0%   --
I tried it myself on my Mac Pro running OS X.8 with a Perl v5.14.2 compiled with the defaults. I didn’t get the same dramatic results:
macpro> perl5.14.2 path-tiny.pl /Volumes/Perl/BackPAN/modules/06perms.txt.gz
     Rate   l   j   g   k   a   b   i   e   d   f   c   h
l 1382/s  -- -1% -1% -1% -1% -1% -1% -1% -1% -2% -3% -3%
j 1395/s  1%  --  0% -0% -0% -0% -0% -0% -0% -1% -2% -2%
g 1395/s  1%  0%  -- -0% -0% -0% -0% -0% -0% -1% -2% -2%
k 1395/s  1%  0%  0%  -- -0% -0% -0% -0% -0% -1% -2% -2%
a 1395/s  1%  0%  0%  0%  -- -0% -0% -0% -0% -1% -2% -2%
b 1395/s  1%  0%  0%  0%  0%  -- -0% -0% -0% -1% -2% -2%
i 1395/s  1%  0%  0%  0%  0%  0%  -- -0% -0% -1% -2% -2%
e 1399/s  1%  0%  0%  0%  0%  0%  0%  -- -0% -1% -2% -2%
d 1400/s  1%  0%  0%  0%  0%  0%  0%  0%  -- -1% -2% -2%
f 1408/s  2%  1%  1%  1%  1%  1%  1%  1%  1%  -- -1% -1%
c 1422/s  3%  2%  2%  2%  2%  2%  2%  2%  2%  1%  -- -0%
h 1422/s  3%  2%  2%  2%  2%  2%  2%  2%  2%  1%  0%  --

macpro> perl5.14.2 path-tiny.pl /Volumes/Perl/BackPAN/modules/06perms.txt.gz
    Rate   a   b   l   k   i   c   e   d   j   h   f   g
a 1370/s  -- -1% -2% -2% -2% -2% -2% -2% -2% -2% -3% -3%
b 1382/s  1%  -- -1% -1% -1% -1% -1% -1% -1% -1% -2% -2%
l 1395/s  2%  1%  --  0%  0% -0% -0% -0% -0% -0% -1% -1%
k 1395/s  2%  1%  0%  --  0% -0% -0% -0% -0% -0% -1% -1%
i 1395/s  2%  1%  0%  0%  -- -0% -0% -0% -0% -0% -1% -1%
c 1395/s  2%  1%  0%  0%  0%  -- -0% -0% -0% -0% -1% -1%
e 1395/s  2%  1%  0%  0%  0%  0%  -- -0% -0% -0% -1% -1%
d 1395/s  2%  1%  0%  0%  0%  0% -0%  -- -0% -0% -1% -1%
j 1399/s  2%  1%  0%  0%  0%  0%  0%  0%  --  0% -1% -1%
h 1399/s  2%  1%  0%  0%  0%  0%  0%  0%  0%  -- -1% -1%
f 1408/s  3%  2%  1%  1%  1%  1%  1%  1%  1%  1%  -- -0%
g 1408/s  3%  2%  1%  1%  1%  1%  1%  1%  1%  1%  0%  --
More interestingly, my results seem to disprove his assertion that there are internal ordering effects at play. That is, Benchmark::Forking doesn’t matter. I was curious about that in his results too, but with modern filesystems doing what they do, the side effects are likely outside of his program. The ordering of the tests relative to each other is unrepeatable, even when I switch to Benchmark::Forking, which only isolates effects inside the program.
I figured this might not be an issue with my particular operating system and setup, so I also tried it on a FreeBSD machine. I got the same non-results. There’s no consistent ordering of tests relative to each other with Benchmark or Benchmark::Forking, and there’s no consistent range of values.
freebsd> perl5.10.1 path-tiny.pl dp-dump.mysql
    Rate    b    h    j    i    a    l    k    g    f    d    e    c
b 1137/s   --  -7% -11% -11% -11% -11% -12% -12% -12% -12% -13% -13%
h 1218/s   7%   --  -4%  -4%  -5%  -5%  -5%  -5%  -5%  -6%  -6%  -6%
j 1273/s  12%   4%   --   0%  -1%  -1%  -1%  -1%  -1%  -2%  -2%  -2%
i 1273/s  12%   4%   0%   --  -1%  -1%  -1%  -1%  -1%  -2%  -2%  -2%
a 1283/s  13%   5%   1%   1%   --  -0%  -0%  -0%  -0%  -1%  -2%  -2%
l 1283/s  13%   5%   1%   1%   0%   --  -0%  -0%  -0%  -1%  -2%  -2%
k 1286/s  13%   6%   1%   1%   0%   0%   --   0%   0%  -1%  -1%  -1%
g 1286/s  13%   6%   1%   1%   0%   0%   0%   --   0%  -1%  -1%  -1%
f 1286/s  13%   6%   1%   1%   0%   0%   0%   0%   --  -1%  -1%  -1%
d 1295/s  14%   6%   2%   2%   1%   1%   1%   1%   1%   --  -1%  -1%
e 1303/s  15%   7%   2%   2%   2%   2%   1%   1%   1%   1%   --   0%
c 1303/s  15%   7%   2%   2%   2%   2%   1%   1%   1%   1%   0%   --

freebsd> perl5.10.1 path-tiny.pl dp-dump.mysql
    Rate   g   h   f   i   d   j   e   l   k   c   b   a
g 1168/s  -- -1% -2% -2% -4% -4% -5% -5% -5% -6% -7% -8%
h 1184/s  1%  -- -1% -1% -3% -3% -3% -3% -3% -4% -6% -6%
f 1193/s  2%  1%  --  0% -2% -2% -3% -3% -3% -4% -5% -6%
i 1193/s  2%  1%  0%  -- -2% -2% -3% -3% -3% -4% -5% -6%
d 1218/s  4%  3%  2%  2%  --  0% -1% -1% -1% -1% -3% -4%
j 1218/s  4%  3%  2%  2%  0%  -- -1% -1% -1% -1% -3% -4%
e 1227/s  5%  4%  3%  3%  1%  1%  --  0%  0% -1% -2% -3%
l 1227/s  5%  4%  3%  3%  1%  1%  0%  --  0% -1% -2% -3%
k 1227/s  5%  4%  3%  3%  1%  1%  0%  0%  -- -1% -2% -3%
c 1236/s  6%  4%  4%  4%  1%  1%  1%  1%  1%  -- -1% -2%
b 1254/s  7%  6%  5%  5%  3%  3%  2%  2%  2%  1%  -- -1%
a 1264/s  8%  7%  6%  6%  4%  4%  3%  3%  3%  2%  1%  --
I suspect that there are a couple of runs of the target code that take abnormally long and skew the results. These happen at certain times regardless of the code being run. A cache adjusts itself, another program is asking for the I/O channels, a disk has to wake up, or something else. In short, these numbers are useless because they treat every run the same despite what happened.
Dumbbench can handle this situation. It times the code, running it enought time to get to a certain precision by ignoring outliers. The Benchmark::Dumb module is a mostly compatible interface, although I specify a number of maximum iterations and a target precision instead of a number of iterations:
#!/usr/bin/perl
# path-tiny.pl

use Benchmark::Dumb qw( cmpthese );
use Path::Tiny;

my $file = $ARGV[0];

my $count = 1000.01;
cmpthese(
    $count, {
        map { $_ => sub { path($file)->slurp } } ("a" .. "l")
        }
        );
The ordering of tests is still not consistent, but the spread of results seems more reasonable and repeatable. This is all running in the same Perl process. The results can be a bit wide since the module also reports uncertainties if it can, but the widget thing should give you the raw text:
freebsd> perl5.10.1 path-tiny.pl dp-dump.mysql
           Rate           k           d           g           e           f           c           l           h           i           j          b     a
k 1135.1+-1.5/s          --       -0.6%       -0.6%       -0.7%       -0.7%       -1.0%       -2.1%       -3.2%       -3.7%       -3.9%      -4.5% -4.7%
d 1141.5+-1.6/s  0.56+-0.2%          --        0.0%       -0.1%       -0.1%       -0.5%       -1.6%       -2.6%       -3.1%       -3.4%      -4.0% -4.1%
g 1141.9+-1.6/s   0.6+-0.2%  0.03+-0.2%          --       -0.1%       -0.1%       -0.5%       -1.5%       -2.6%       -3.1%       -3.4%      -4.0% -4.1%
e 1142.9+-1.5/s 0.68+-0.19% 0.12+-0.19% 0.09+-0.19%          --        0.0%       -0.4%       -1.4%       -2.5%       -3.0%       -3.3%      -3.9% -4.0%
f 1142.9+-1.5/s 0.69+-0.19%  0.12+-0.2% 0.09+-0.19%    0+-0.19%          --       -0.4%       -1.4%       -2.5%       -3.0%       -3.3%      -3.9% -4.0%
c 1147.1+-1.4/s 1.06+-0.19% 0.49+-0.19% 0.46+-0.19% 0.37+-0.18% 0.37+-0.18%          --       -1.1%       -2.2%       -2.7%       -2.9%      -3.5% -3.6%
l 1159.6+-1.5/s 2.16+-0.19% 1.59+-0.19% 1.55+-0.19% 1.46+-0.18% 1.46+-0.19% 1.09+-0.18%          --       -1.1%       -1.6%       -1.9%      -2.5% -2.6%
h 1172.4+-1.4/s 3.29+-0.19% 2.71+-0.19% 2.68+-0.19% 2.59+-0.18% 2.58+-0.19% 2.21+-0.18% 1.11+-0.18%          --       -0.5%       -0.8%      -1.4% -1.5%
i 1178.6+-1.2/s 3.83+-0.18% 3.25+-0.18% 3.22+-0.18% 3.13+-0.17% 3.12+-0.17% 2.75+-0.17% 1.64+-0.17% 0.53+-0.16%          --       -0.3%      -0.9% -1.0%
j 1181.6+-1.2/s  4.1+-0.18% 3.52+-0.18% 3.48+-0.18% 3.39+-0.17% 3.39+-0.17% 3.01+-0.17%  1.9+-0.17% 0.79+-0.16% 0.26+-0.15%          --      -0.6% -0.7%
b   1189+-1.7/s 4.75+-0.21% 4.16+-0.21% 4.13+-0.21%  4.04+-0.2%  4.03+-0.2%  3.65+-0.2%  2.54+-0.2% 1.41+-0.19% 0.88+-0.18% 0.62+-0.18%         -- -0.1%
a 1190.5+-1.7/s 4.88+-0.21%  4.3+-0.21% 4.26+-0.21%  4.17+-0.2%  4.17+-0.2%  3.79+-0.2%  2.67+-0.2% 1.54+-0.19% 1.01+-0.18% 0.75+-0.18% 0.13+-0.2%    --

freebsd> perl5.10.1 path-tiny.pl dp-dump.mysql
             Rate    g     l     k     j     i     h     f     a     b     c     d     e
g 1240.26+-0.72/s   -- -0.5% -0.9% -1.0% -1.0% -1.1% -1.4% -1.6% -1.7% -1.7% -1.7% -1.8%
l 1246.11+-0.44/s 0.5%    -- -0.4% -0.5% -0.5% -0.6% -0.9% -1.1% -1.2% -1.2% -1.3% -1.4%
k 1251.06+-0.33/s 0.9%  0.4%    -- -0.1% -0.1% -0.2% -0.5% -0.7% -0.8% -0.8% -0.9% -1.0%
j 1252.18+-0.31/s 1.0%  0.5%  0.1%    --  0.0% -0.1% -0.4% -0.6% -0.7% -0.8% -0.8% -0.9%
i 1252.33+-0.38/s 1.0%  0.5%  0.1%  0.0%    -- -0.1% -0.4% -0.6% -0.7% -0.7% -0.8% -0.9%
h 1253.57+-0.28/s 1.1%  0.6%  0.2%  0.1%  0.1%    -- -0.3% -0.5% -0.6% -0.6% -0.7% -0.8%
f 1257.46+-0.21/s 1.4%  0.9%  0.5%  0.4%  0.4%  0.3%    -- -0.2% -0.3% -0.3% -0.4% -0.5%
a 1260.16+-0.23/s 1.6%  1.1%  0.7%  0.6%  0.6%  0.5%  0.2%    -- -0.1% -0.1% -0.2% -0.3%
b 1261.46+-0.15/s 1.7%  1.2%  0.8%  0.7%  0.7%  0.6%  0.3%  0.1%    --  0.0% -0.1% -0.2%
c 1261.75+-0.15/s 1.7%  1.3%  0.9%  0.8%  0.8%  0.7%  0.3%  0.1%  0.0%    --  0.0% -0.1%
d 1262.23+-0.19/s 1.8%  1.3%  0.9%  0.8%  0.8%  0.7%  0.4%  0.2%  0.1%  0.0%    -- -0.1%
e 1263.52+-0.14/s 1.9%  1.4%  1.0%  0.9%  0.9%  0.8%  0.5%  0.3%  0.2%  0.1%  0.1%    --

freebsd> perl5.10.1 path-tiny.pl dp-dump.mysql
           Rate           f           i           e           h           g           l           k           j           d           c           b     a
f 1186.1+-1.8/s          --       -0.2%       -0.2%       -0.2%       -0.3%       -0.6%       -0.9%       -1.6%       -2.3%       -3.2%       -3.2% -3.4%
i 1188.1+-1.6/s 0.17+-0.21%          --        0.0%       -0.1%       -0.1%       -0.4%       -0.7%       -1.4%       -2.1%       -3.0%       -3.0% -3.3%
e 1188.2+-1.8/s 0.17+-0.21%     0+-0.2%          --       -0.1%       -0.1%       -0.4%       -0.7%       -1.4%       -2.1%       -3.0%       -3.0% -3.3%
h   1189+-1.6/s 0.24+-0.21%  0.07+-0.2%  0.07+-0.2%          --       -0.1%       -0.3%       -0.7%       -1.4%       -2.0%       -3.0%       -3.0% -3.2%
g 1189.8+-1.8/s 0.31+-0.22% 0.14+-0.21% 0.14+-0.22% 0.07+-0.21%          --       -0.3%       -0.6%       -1.3%       -2.0%       -2.9%       -2.9% -3.1%
l 1192.8+-1.8/s 0.57+-0.21%  0.4+-0.21% 0.39+-0.21%  0.32+-0.2% 0.26+-0.22%          --       -0.3%       -1.1%       -1.7%       -2.6%       -2.7% -2.9%
k 1196.8+-1.7/s  0.9+-0.21%  0.73+-0.2% 0.73+-0.21%  0.66+-0.2% 0.59+-0.21% 0.33+-0.21%          --       -0.7%       -1.4%       -2.3%       -2.3% -2.6%
j 1205.5+-1.6/s  1.63+-0.2% 1.46+-0.19%  1.46+-0.2% 1.39+-0.19% 1.32+-0.21%  1.06+-0.2% 0.72+-0.19%          --       -0.7%       -1.6%       -1.6% -1.9%
d 1213.8+-1.4/s 2.34+-0.19% 2.16+-0.18% 2.16+-0.19% 2.09+-0.18%  2.02+-0.2% 1.76+-0.19% 1.42+-0.19% 0.69+-0.18%          --       -0.9%       -0.9% -1.2%
c 1225.3+-1.3/s  3.3+-0.19% 3.13+-0.18% 3.12+-0.19% 3.05+-0.18% 2.98+-0.19% 2.72+-0.19% 2.38+-0.18% 1.64+-0.17% 0.94+-0.16%          --        0.0% -0.2%
b 1225.4+-1.1/s 3.31+-0.18% 3.14+-0.17% 3.13+-0.18% 3.06+-0.17% 2.99+-0.19% 2.73+-0.18% 2.39+-0.17% 1.65+-0.16% 0.95+-0.15% 0.01+-0.14%          -- -0.2%
a 1228.3+-1.3/s 3.56+-0.19% 3.38+-0.18% 3.38+-0.19% 3.31+-0.18% 3.24+-0.19% 2.97+-0.19% 2.63+-0.18% 1.89+-0.17% 1.19+-0.16% 0.25+-0.15% 0.24+-0.14%    --

freebsd> perl5.10.1 path-tiny.pl dp-dump.mysql
             Rate           b           a     h     i     g     e     c     j     f     d     l     k
b   1177.9+-1.2/s          --       -1.1% -2.5% -2.8% -2.8% -2.8% -2.9% -2.9% -3.1% -3.1% -3.1% -3.2%
a   1191.1+-1.1/s 1.12+-0.14%          -- -1.5% -1.7% -1.7% -1.7% -1.8% -1.9% -2.0% -2.0% -2.0% -2.1%
h 1208.64+-0.64/s 2.61+-0.12% 1.48+-0.11%    -- -0.2% -0.2% -0.3% -0.4% -0.4% -0.5% -0.6% -0.6% -0.7%
i 1211.27+-0.69/s 2.83+-0.12%  1.7+-0.11%  0.2%    --  0.0%  0.0% -0.2% -0.2% -0.3% -0.4% -0.4% -0.5%
g  1211.54+-0.5/s 2.86+-0.12%  1.72+-0.1%  0.2%  0.0%    --  0.0% -0.2% -0.2% -0.3% -0.3% -0.4% -0.4%
e 1211.67+-0.55/s 2.87+-0.12% 1.73+-0.11%  0.3%  0.0%  0.0%    -- -0.1% -0.2% -0.3% -0.3% -0.4% -0.4%
c 1213.44+-0.42/s 3.02+-0.11%  1.88+-0.1%  0.4%  0.2%  0.2%  0.1%    --  0.0% -0.1% -0.2% -0.2% -0.3%
j   1213.6+-0.5/s 3.03+-0.12%  1.89+-0.1%  0.4%  0.2%  0.2%  0.2%  0.0%    -- -0.1% -0.2% -0.2% -0.3%
f  1215.2+-0.38/s 3.17+-0.11%  2.03+-0.1%  0.5%  0.3%  0.3%  0.3%  0.1%  0.1%    --  0.0% -0.1% -0.1%
d 1215.57+-0.36/s  3.2+-0.11%        2.1%  0.6%  0.4%  0.3%  0.3%  0.2%  0.2%  0.0%    --  0.0% -0.1%
l 1215.96+-0.36/s 3.23+-0.11%  2.09+-0.1%  0.6%  0.4%  0.4%  0.4%  0.2%  0.2%  0.1%  0.0%    -- -0.1%
k 1216.84+-0.31/s 3.31+-0.11%        2.2%  0.7%  0.5%  0.4%  0.4%  0.3%  0.3%  0.1%  0.1%  0.1%    --
It’s more interesting to use the dumbbench program because I can get the data as a table instead of as a summary. I create a package that I could pass to dumbbench:
package PathTinyTest;

use v5.10;
use strict;
use warnings;
use Benchmark qw( cmpthese );
use Path::Tiny;

my $file = '/Volumes/Perl/BackPAN/modules/06perms.txt.gz';

# special subroutine for dumbbench --package
sub get_subs_to_benchmark { 'a' .. 'l' }

foreach ( get_subs_to_benchmark() ) {
	no strict 'refs';
	*{"$_"} = sub { path($file)->slurp };
	}

1;
I give that package to dumbbench:
% dumbbench --package PathTinyTest --t pathtiny.dat
Once I the table data, I can pass that to R to plot. It’s much easier to use a proper statistical package than fool with Perl modules. This boxplot.r script comes in the Dumbbench distribution:
file <- commandArgs(trailingOnly=T)[1]
print( file )
t <- read.table(
        file,
        sep="\t",
        header=T,
        fill=T
        )

base <- sub( "(^[^.]+).*", "\\1", file )
image <- paste( base, "png", sep="." )
png( image )

p <- list(
        boxwex = 0.1,
        ylab   = "Times, s"
        )
boxplot( t, pars=p )
I invoke it:
% Rscript --vanilla --slave boxplot.r pathtiny.dat
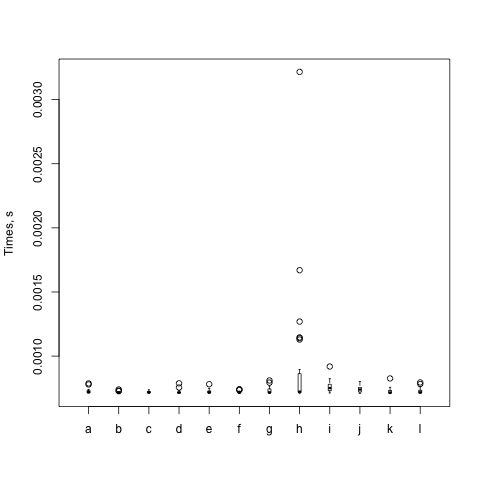
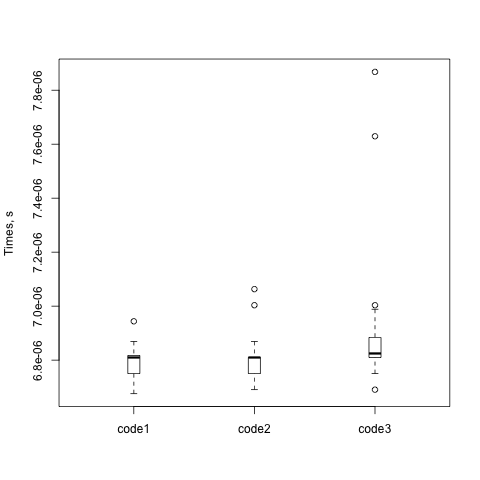
And I get a plot:
This box plot shows just what I suspected. Most of the interesting data are pretty much the same. Each circle is something far off the mean, and there's one of h that's really far off. The box for h is also very tall while the others are very short. There's a lot of variability in that particular set of runs.
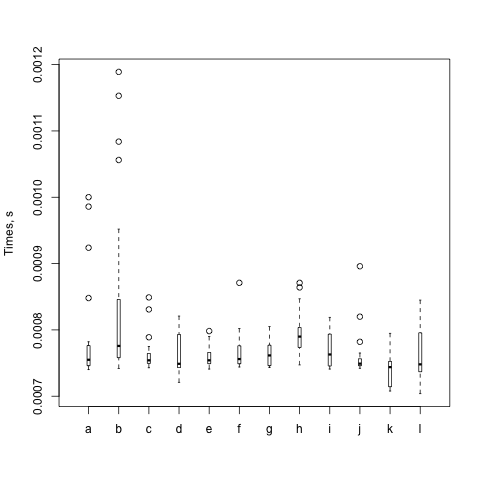
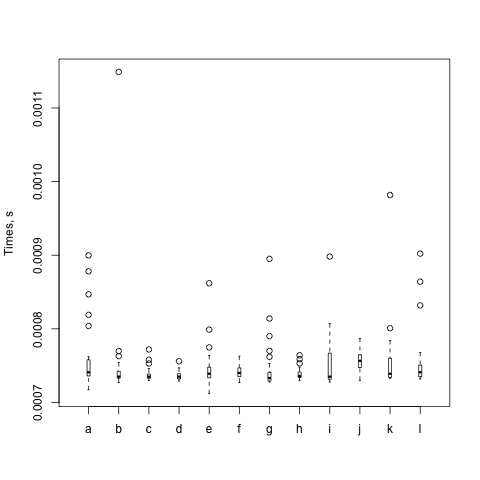
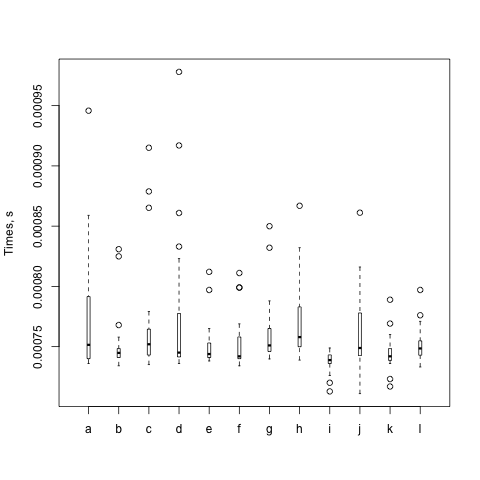
As with all benchmarks, I try again (and again). The box itself represents the middle 50%, or 1 σ, and the whiskers represent 2 σ. Eventhing else is shown as a circle. The black bar is the mean. Steffen gives some gory details about the distribution in The physicist's way out. Imagine his plots as if you are looking down their Y axes and lining them up next to each other.
So, I think David gets it wrong in that particular benchmark. If there was something odd going on, I'd expect the means to be much different from each other. They aren't.
This is the danger I talk about in the "Benchmarking" chapter. The numbers are only good if they let you understand something. Once you think you understand it, you need to come up with a way to poke that particular thing in a way that demonstrates you know why it does what it does. Here we don't know why the numbers and spread come out as they do or how they relate to each other. Getting numbers that you like better doesn't make them more real.
But, as a true scientist, I also can't say that David is wrong. The most I can say is that he hasn't adequately supported his claim about forking. Or, I should say, that his results might only matter for him, which is another thing I stress in the "Benchmarking" chapter. That no one else can reproduce them on different setups might not matter. He isn't trying to prove a new law of the universe. He just needs to show that when he makes that one change, things work out better for him. Everyone else can run his benchmarks to see if it works out better for them.
This is unrelated to his conclusions about Path::Tiny, which probably is faster than the other modules that do similar things.